Texas 3rd congressional district
TX-3 · 119th Congress (2020 Census) · 846,484 residents · Federal money here
Where TX-3 sits in Texas
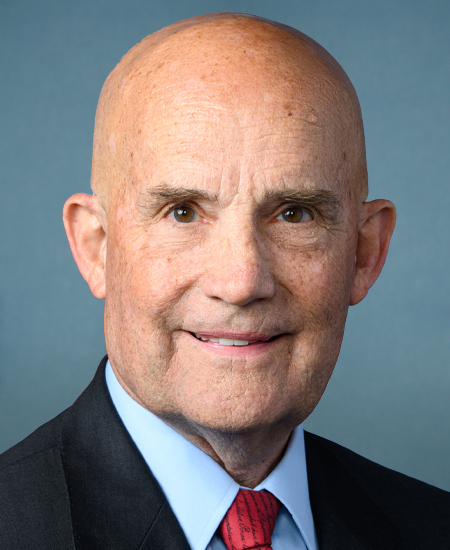
Current representative
Keith Self
Republican · holding this seat since 2023
Recorded votes
Yea 1,325Nay 530
of 1,878 roll calls across their career.
Government experience
- House · TX-32025–2027
- House · TX-32023–2025
Where their votes land
Personal finances
Separately from the campaign money above, Keith Self files a report about their own money: what they own, what they owe, what they earn outside Congress, and every stock trade they make. The law requires it, and every figure in it is a range rather than an amount — which is why the columns below are ranges too.
Latest figures — Measured on this ground since they took the seat
Click one of the figures to see how it has changed over time.
- Population846,484▲ up 8.5%2018-2022 → 2020-2024redrawn
- Median age37.7 yrs→ no measurable change2018-2022 → 2020-2024redrawn
- Median income$121,914▲ up 7.5%up 0.3% after inflation2018-2022 → 2020-2024redrawn
- Poverty rate6.2%▼ down 0.0 pp2018-2022 → 2020-2024redrawn
- Child poverty rate7.4%▲ up 0.0 pp2018-2022 → 2020-2024redrawn
- Unemployment rate4.1%▼ down 0.0 pp2018-2022 → 2020-2024redrawn
- Unemployment (BLS)3.9% allocated▲ up 0.6 pp2022 → 2025redrawn
- SNAP receipt4.0%▲ up 0.2 pp2018-2022 → 2020-2024redrawn
- Gini index0.428▼ down 0.3%2018-2022 → 2020-2024redrawn
- Median home value$449,700▲ up 17.6%up 9.7% after inflation2018-2022 → 2020-2024redrawn
- Median gross rent$1,861▲ up 12.7%up 5.2% after inflation2018-2022 → 2020-2024redrawn
- Cost-burdened renters48.0%▲ up 0.9 pp2018-2022 → 2020-2024redrawn
- Homeownership rate73.4%▲ up 0.1 pp2018-2022 → 2020-2024redrawn
- Housing vacancy rate5.0%▼ down 0.6 pp2018-2022 → 2020-2024redrawn
- Uninsured rate9.8%▼ down 0.2 pp2018-2022 → 2020-2024redrawn
- Disability rate8.9%▲ up 0.6 pp2018-2022 → 2020-2024redrawn
- Overdose deaths10.5 per 100k allocatedno earlier figure2022-2024
- Child mortality39.8 per 100k allocatedno earlier figure2020-2024
- Low birth weight7.6% allocatedno earlier figure2020-2024
- Teen births4.4 per 1k▼ down 44.6%2018-2022 → 2020-2024redrawn
- Bachelor's+50.2%▲ up 1.7 pp2018-2022 → 2020-2024redrawn
- No internet3.2%▼ down 1.3 pp2018-2022 → 2020-2024redrawn
- Firearm deaths10.1 per 100k allocatedno earlier figure2020-2024
- Injury deaths47.6 per 100k allocatedno earlier figure2020-2024
- Crash deaths8.8 per 100k allocatedno earlier figure2020-2024
- GDP$79.8B allocated▼ down 6.7%down 12.9% after inflation2022 → 2024redrawn
- GDP per person$87,678 allocated▲ up 6.3%down 0.9% after inflation2022 → 2024redrawn
- Covered jobs380.2k allocatedno earlier figure2024
- Weekly wage$1,655 allocatedno earlier figure2024
- Income per person$85,085 allocated▲ up 2.8%down 4.1% after inflation2022 → 2024redrawn
- Businesses24.0k allocatedno earlier figure2024
Each arrow is the latest published figure against the newest one published before Keith Self took this seat, with the two periods named beside it. A rate moves in percentage points; every other indicator is shown as a share of where it started, and a dollar figure also by how much it moved after inflation, with both figures restated in the same year’s dollars. A row marked redrawn is one whose district lines moved between the two figures: they describe different ground, so that change belongs to the seat number rather than to a fixed piece of land. A row marked earliest had nothing published before they took the seat, so it is measured from the first figure there is — a window that starts inside their tenure rather than at the beginning of it. These are conditions in the district, not a record of the member. Nothing here is evidence that they caused any of it, or that a different representative would have produced different numbers.
Median household income over time, 2005-2009 to 2020-2024
Half of households in the district earn more than this, half less.
| Period | Median income | In 2025 dollars | Margin of error | Congress |
|---|---|---|---|---|
| 2005-2009 | $68,351 | $102,570 | ± $802 | 111th |
| 2006-2010 | $68,916 | $101,749 | ± $743 | 111th |
| 2007-2011 | $70,156 | $100,410 | ± $845 | 112th |
| Lines redrawn for the 113th Congress — figures above and below describe different areas.2008-2012 | $84,467 | $118,442 | ± $1,086 | 113th |
| 2009-2013 | $84,014 | $116,106 | ± $1,194 | 113th |
| 2010-2014 | $85,330 | $116,042 | ± $1,213 | 114th |
| 2011-2015 | $85,752 | $116,478 | ± $1,247 | 114th |
| 2012-2016 | $86,783 | $116,410 | ± $1,008 | 115th |
| 2013-2017 | $90,604 | $119,000 | ± $1,089 | 115th |
| 2014-2018 | $94,366 | $120,986 | ± $1,103 | 116th |
| 2015-2019 | $96,905 | $122,030 | ± $1,149 | 116th |
| 2016-2020 | $100,748 | $125,324 | ± $1,269 | 116th |
| 2017-2021 | $104,676 | $124,367 | ± $1,651 | 116th |
| Lines redrawn for the 118th Congress — figures above and below describe different areas.2018-2022 | $113,405 | $124,754 | ± $1,842 | 118th |
| 2019-2023 | $117,653 | $124,310 | ± $2,192 | 118th |
| 2020-2024 | $121,914 | $125,122 | ± $2,148 | 119th |
The "in 2025 dollars" figures are the published ones restated for inflation with the BLS Consumer Price Index for All Urban Consumers (CPI-U), U.S. city average, all items, annual average. A five-year estimate is published in the dollars of its final year, so 2016-2020 is adjusted from 2020 dollars. The adjustment is the same for every place in a period, so it changes no ranking; it says what a figure from an earlier period would be in today's money. It is not a local cost of living, and the margin of error is still the published one.
Nominal dollars as published for each period -- not inflation-adjusted. A median cannot be averaged across areas, so this is published district-level data only.
This is a median. It is published as measured and is never re-aggregated from smaller areas — averaging medians does not produce a median.
Who represented this district
Every member who held TX-3, grouped by the stretches over which these lines stayed the same. The groups break where the chart above breaks, because the members either side of a redraw represented different ground.
| Member | Party | Years | Lines in force |
|---|---|---|---|
| Sam Johnson · 2 terms | Republican | 2009–2013 | 111th–112th Congresses |
| Lines redrawn for the 113th Congress — figures above and below describe different areas.Sam Johnson · 3 terms | Republican | 2013–2019 | 113th–116th Congresses |
| Van Taylor · 2 terms | Republican | 2019–2023 | |
| Lines redrawn for the 118th Congress — figures above and below describe different areas.Keith Self · 2 terms | Republican | 2023–present | 118th–119th Congresses |
Party is the party held during that term, not the member’s party today. A stretch ends where the district was redrawn: the members either side of a break represented different ground, so the seat number is the only thing they have in common. Nothing here says a member caused any figure on this page to move. Source: unitedstates/congress-legislators.