Oklahoma
OK · 5 congressional seats · 2 Senate seats · Federal money in Oklahoma
Oklahoma by congressional district
Oklahoma broken into its seats. Click a district to open its own page, where every figure below is measured against the boundaries in force when it was published.
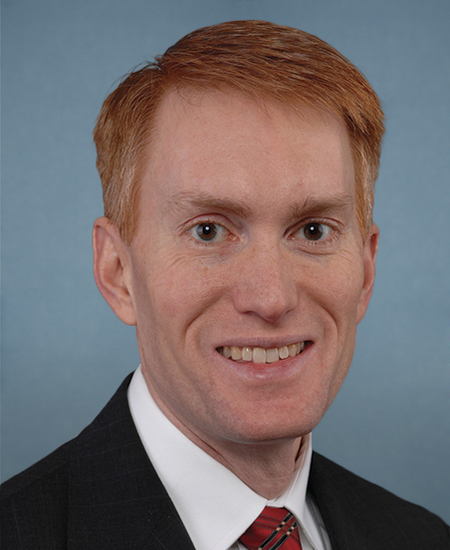
Current senator
James Lankford
Republican · holding this seat since 2015
Recorded votes
Yea 4,289Nay 2,752
of 7,180 roll calls across their career.
Government experience
- Senate · OK2023–2029
- Senate · OK2017–2023
- Senate · OK2015–2017
- House · OK-52013–2015
- House · OK-52011–2013
Where their votes land
Where the money came from
Receipts into James Lankford’s own campaign committee over the 2025–2026 election cycle, through June 30, 2026.
What these categories mean
- Small individual donors
- People whose giving stayed under $200 in total. The FEC does not require them to be named, so who they are is genuinely unknown — not merely unlisted.
- Large individual donors
- People whose giving passed $200, which is the point at which the campaign must report their name, employer and occupation.
- PACs
- Political action committees — corporate, trade, union and ideological. Money from an organisation rather than from a person.
- Transfers in
- Money moved in from another committee the candidate is authorised by, typically a joint fundraising committee.
- Other and unclassified
- The remainder once every category above is accounted for: federal funds, offsets, interest, and anything this site could not classify. It is a residual, not a kind of donor.
This is money the campaign itself received. It is not everything spent to win the seat. It excludes leadership PACs, and it excludes independent expenditures and other outside spending — money spent to elect or defeat a candidate by groups they may not lawfully coordinate with, which in a contested race can exceed everything shown above. It is not personal income or net worth, which are a separate filing altogether. Figures are as filed with the Federal Election Commission and are only as current as the last report, covering through June 30, 2026; a cycle still running is a partial count. Check this filing on fec.gov.
Personal finances
Separately from the campaign money above, James Lankford files a report about their own money: what they own, what they owe, what they earn outside Congress, and every stock trade they make. The law requires it, and every figure in it is a range rather than an amount — which is why the columns below are ranges too.
From James Lankford’s own financial disclosure, filed under the Ethics in Government Act. Every figure is the band the filer ticked.

Current senator
Alan Armstrong
Republican · holding this seat since 2026
Recorded votes
Yea 116Nay 75
of 191 roll calls across their career.
Government experience
- Senate · OK2026–2027
Where their votes land
No overall position: fewer than 3 values have 4 or more of their votes.
Personal finances
Separately from the campaign money above, Alan Armstrong files a report about their own money: what they own, what they owe, what they earn outside Congress, and every stock trade they make. The law requires it, and every figure in it is a range rather than an amount — which is why the columns below are ranges too.
From Alan Armstrong’s own financial disclosure, filed under the Ethics in Government Act. Every figure is the band the filer ticked.
Oklahoma’s economy
The Bureau of Labor Statistics publishes no inflation rate for Oklahoma: prices are collected from a sample built for the nation, the four Census regions and a handful of large metro areas, and nothing in it supports a state figure. The nearest published figure is the South region's, below. See inflation for the country and the four regions.
| Measure | Value | Over a year | Period |
|---|---|---|---|
| Gross domestic product | $263.7B | up $7.8B | 2024 |
| Real GDP growth | 1.6% | already a 12-month change | 2024 |
| GDP per person | $64,351 | up 2.2% | 2024 |
| Payroll jobs | 1.8Mprelim. | up 12.7k | August 2026 |
| Jobs added over 12 months | 12,700prelim. | already a 12-month change | August 2026 |
| Unemployment rate (monthly) | 4.3%prelim. | up 0.9 pp | August 2026 |
| Covered jobs | 1.7M | no figure a year earlier | 2024 |
| Average weekly wage | $1,129 | no figure a year earlier | 2024 |
| Personal income per person | $63,671 | up 4.6% | 2024 |
| Goods exported | $7.5B | down $304.1M | 2025 |
| Goods imported | $17.1B | down $850.4M | 2025 |
| Trade balance in goods | -$9.6B | up $546.3M | 2025 |
| Business establishments | 129.1k | no figure a year earlier | 2024 |
Every figure here is one its source published for Oklahomaitself — nothing is summed from the districts. Payroll jobs and the monthly unemployment rate are seasonally adjusted, and the two newest months of the payroll series are preliminary and get revised. Output is counted where production happens and income where people live, so the two say different things about the same state. An arrow is coloured by the direction its own measure counts as improvement — green on rising output, jobs, income and exports, green on a falling unemployment rate — and stays grey where there is no such direction to claim, as for imports and the count of businesses. The colour is not a claim about anybody.
Latest figures
Click one of the figures to see how it has changed over time.
| Indicator | Value | Margin of error | Period |
|---|---|---|---|
| Total population | 4,028,634 | — | 2020-2024 |
| Median age | 37.0 yrs | ± 0.1 yrs | 2020-2024 |
| Median household income | $65,039 | ± $439 | 2020-2024 |
| Poverty rate | 15.3% | ± 0.2% | 2020-2024 |
| Child poverty rate | 20.1% | ± 0.3% | 2020-2024 |
| Unemployment rate | 5.0% | ± 0.1% | 2020-2024 |
| Households receiving SNAP | 14.1% | ± 0.2% | 2020-2024 |
| Income inequality (Gini index) | 0.467 | ± 0.003 | 2020-2024 |
| Median home value | $199,800 | ± $1,121 | 2020-2024 |
| Median gross rent | $1,014 | ± $6 | 2020-2024 |
| Cost-burdened renters | 46.3% | ± 0.6% | 2020-2024 |
| Homeownership rate | 65.8% | ± 0.2% | 2020-2024 |
| Housing vacancy rate | 12.0% | ± 0.1% | 2020-2024 |
| Uninsured rate | 12.9% | ± 0.1% | 2020-2024 |
| Disability rate | 17.2% | ± 0.1% | 2020-2024 |
| Drug overdose deaths | 28.7 per 100k | — | 2022-2024 |
| Child mortality | 65.9 per 100k | — | 2020-2024 |
| Low birth weight | 8.5% | — | 2020-2024 |
| Teen birth rate | 16.1 per 1k | ± 2.8 per 1k | 2020-2024 |
| Bachelor's degree or higher | 28.3% | ± 0.2% | 2020-2024 |
| Households without internet access | 8.4% | ± 0.2% | 2020-2024 |
| Firearm fatalities | 20.2 per 100k | — | 2020-2024 |
| Injury deaths | 109.5 per 100k | — | 2020-2024 |
| Motor vehicle crash deaths | 18.4 per 100k | — | 2020-2024 |
US Census Bureau, American Community Survey; CDC WONDER, National Center for Health Statistics. Margins of error are at the 90% confidence level. An estimate is not a count. Every figure here is one its source published for Oklahoma itself. Nothing is averaged up from the districts, because five of these indicators are medians and the average of medians is not a median, and nothing is summed from counties. No figure here is shown as a change since anybody took office: a state has two senators who took their seats in different years, so there is no single tenure to measure from.
Median household income over time, 2005-2009 to 2020-2024
Pick an indicator, and a second to compare it with. Where they share a unit and a scale they are read against one axis; where they do not, the second gets an axis of its own on the right — nothing is rebased or rescaled to make two units meet. Tick the box to draw them apart instead.
Half of households in Oklahoma earn more than this, half less.
| Period | Median income | In 2025 dollars | Margin of error | United States (reference) |
|---|---|---|---|---|
| 2005-2009 | $41,861 | $62,818 | ± $256 | $51,425 |
| 2006-2010 | $42,979 | $63,455 | ± $265 | $51,914 |
| 2007-2011 | $44,287 | $63,386 | ± $217 | $52,762 |
| 2008-2012 | $44,891 | $62,947 | ± $237 | $53,046 |
| 2009-2013 | $45,339 | $62,658 | ± $196 | $53,046 |
| 2010-2014 | $46,235 | $62,876 | ± $201 | $53,482 |
| 2011-2015 | $46,879 | $63,676 | ± $216 | $53,889 |
| 2012-2016 | $48,038 | $64,438 | ± $247 | $55,322 |
| 2013-2017 | $49,767 | $65,364 | ± $240 | $57,652 |
| 2014-2018 | $51,424 | $65,930 | ± $213 | $60,293 |
| 2015-2019 | $52,919 | $66,640 | ± $225 | $62,843 |
| 2016-2020 | $53,840 | $66,973 | ± $375 | $64,994 |
| 2017-2021 | $56,956 | $67,670 | ± $382 | $69,021 |
| 2018-2022 | $61,364 | $67,505 | ± $451 | $75,149 |
| 2019-2023 | $63,603 | $67,202 | ± $419 | $78,538 |
| 2020-2024 | $65,039 | $66,750 | ± $439 | $80,734 |
The "in 2025 dollars" figures are the published ones restated for inflation with the BLS Consumer Price Index for All Urban Consumers (CPI-U), U.S. city average, all items, annual average. A five-year estimate is published in the dollars of its final year, so 2016-2020 is adjusted from 2020 dollars. The adjustment is the same for every place in a period, so it changes no ranking; it says what a figure from an earlier period would be in today's money. It is not a local cost of living, and the margin of error is still the published one.
Nominal dollars as published for each period -- not inflation-adjusted. A median cannot be averaged across areas, so this is published district-level data only.
This is a median or an index. It is published as measured and is never re-aggregated from smaller areas — averaging medians does not produce a median.
Districts
Who has represented Oklahoma
Every senator who has held one of Oklahoma’s two seats, newest first. The record carries no Senate class, so this is one chronology rather than two seat lineages — and unlike a district, a state is the same ground throughout, so there is nothing to break the list at.
| Senator | Party | Years |
|---|---|---|
| Alan Armstrong | Republican | 2026–present |
| Markwayne Mullin | Republican | 2023–2026 |
| James Lankford · 3 terms | Republican | 2015–present |
| Tom Coburn · 2 terms | Republican | 2005–2015 |
| James M. Inhofe · 6 terms | Republican | 1994–2023 |
| Don Nickles · 4 terms | Republican | 1981–2005 |
| David Boren · 3 terms | Democrat | 1979–1994 |
| Henry Bellmon | Republican | 1975–1981 |
| Dewey Bartlett | Republican | 1973–1979 |
| Henry Bellmon | Republican | 1969–1975 |
| Fred Harris · 2 terms | Democrat | 1964–1973 |
| James Edmondson | Democrat | 1963–1964 |
| Almer Monroney · 3 terms | Democrat | 1951–1969 |
| Robert Kerr · 3 terms | Democrat | 1949–1963 |
| Edward Moore | Republican | 1943–1949 |
| Joshua Lee | Democrat | 1937–1943 |
| Thomas Gore | Democrat | 1931–1937 |
| John Thomas · 4 terms | Democrat | 1927–1951 |
| William Pine | Republican | 1925–1931 |
| John Harreld | Republican | 1921–1927 |
| Robert Owen | Democrat | 1919–1925 |
| Thomas Gore | Democrat | 1915–1921 |
| Robert Owen | Democrat | 1913–1919 |
| Thomas Gore | Democrat | 1909–1915 |
| Thomas Gore | Democrat | 1907–1909 |
| Robert Owen | Democrat | 1907–1913 |