Nebraska 3rd congressional district
NE-3 · 119th Congress (2020 Census) · 652,059 residents · Federal money here
Where NE-3 sits in Nebraska
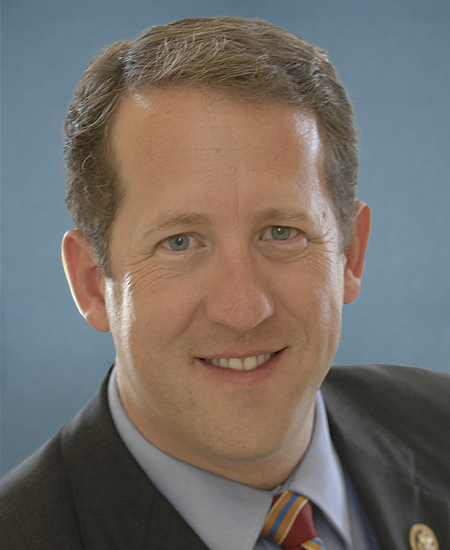
Current representative
Adrian Smith
Republican · holding this seat since 2007
Recorded votes
Yea 7,972Nay 4,509
of 12,671 roll calls across their career.
Government experience
- House · NE-32025–2027
- House · NE-32023–2025
- House · NE-32021–2023
- House · NE-32019–2021
- House · NE-32017–2019
- House · NE-32015–2017
- House · NE-32013–2015
- House · NE-32011–2013
- House · NE-32009–2011
- House · NE-32007–2009
Where their votes land
Where the money came from
Receipts into Adrian Smith’s own campaign committee over the 2025–2026 election cycle, through June 30, 2026.
What these categories mean
- Small individual donors
- People whose giving stayed under $200 in total. The FEC does not require them to be named, so who they are is genuinely unknown — not merely unlisted.
- Large individual donors
- People whose giving passed $200, which is the point at which the campaign must report their name, employer and occupation.
- PACs
- Political action committees — corporate, trade, union and ideological. Money from an organisation rather than from a person.
- Transfers in
- Money moved in from another committee the candidate is authorised by, typically a joint fundraising committee.
- Other and unclassified
- The remainder once every category above is accounted for: federal funds, offsets, interest, and anything this site could not classify. It is a residual, not a kind of donor.
This is money the campaign itself received. It is not everything spent to win the seat. It excludes leadership PACs, and it excludes independent expenditures and other outside spending — money spent to elect or defeat a candidate by groups they may not lawfully coordinate with, which in a contested race can exceed everything shown above. It is not personal income or net worth, which are a separate filing altogether. Figures are as filed with the Federal Election Commission and are only as current as the last report, covering through June 30, 2026; a cycle still running is a partial count. Check this filing on fec.gov.
Personal finances
Separately from the campaign money above, Adrian Smith files a report about their own money: what they own, what they owe, what they earn outside Congress, and every stock trade they make. The law requires it, and every figure in it is a range rather than an amount — which is why the columns below are ranges too.
From Adrian Smith’s own financial disclosure, filed under the Ethics in Government Act. Every figure is the band the filer ticked.
Latest figures — Measured on this ground since they took the seat
Click one of the figures to see how it has changed over time.
- Population652,059▲ up 18.0%2005-2009 → 2020-2024redrawnearliest
- Median age40.2 yrs▼ down 0.2%2005-2009 → 2020-2024redrawnearliest
- Median income$68,556▲ up 62.3%up 11.0% after inflation2005-2009 → 2020-2024redrawnearliest
- Poverty rate10.9%▼ down 1.1 pp2005-2009 → 2020-2024redrawnearliest
- Child poverty rate12.5%▼ down 3.1 pp2005-2009 → 2020-2024redrawnearliest
- Unemployment rate2.6%▼ down 1.8 pp2007-2011 → 2020-2024redrawnearliest
- Unemployment (BLS)2.9% allocated▼ down 1.3 pp2009 → 2025redrawnearliest
- SNAP receipt8.3%▼ down 0.0 pp2008-2012 → 2020-2024redrawnearliest
- Gini index0.443▲ up 6.4%2006-2010 → 2020-2024redrawnearliest
- Median home value$180,300▲ up 105.1%up 40.3% after inflation2005-2009 → 2020-2024redrawnearliest
- Median gross rent$859▲ up 60.6%up 9.8% after inflation2005-2009 → 2020-2024redrawnearliest
- Cost-burdened renters40.8%▲ up 4.9 pp2005-2009 → 2020-2024redrawnearliest
- Homeownership rate71.6%▲ up 0.6 pp2005-2009 → 2020-2024redrawnearliest
- Housing vacancy rate11.8%▼ down 1.5 pp2005-2009 → 2020-2024redrawnearliest
- Uninsured rate7.7%▼ down 4.4 pp2008-2012 → 2020-2024redrawnearliest
- Disability rate14.2%▲ up 1.4 pp2008-2012 → 2020-2024redrawnearliest
- Overdose deaths5.9 per 100k allocatedno earlier figure2022-2024
- Child mortality55.4 per 100k allocatedno earlier figure2020-2024
- Teen births8.3 per 1k▼ down 73.6%2006-2010 → 2020-2024redrawnearliest
- Bachelor's+25.0%▲ up 5.8 pp2005-2009 → 2020-2024redrawnearliest
- No internet9.5%▼ down 12.5 pp2013-2017 → 2020-2024redrawnearliest
- Firearm deaths10.6 per 100k allocatedno earlier figure2020-2024
- Injury deaths79.0 per 100k allocatedno earlier figure2020-2024
- Crash deaths17.3 per 100k allocatedno earlier figure2020-2024
- GDP$56.2B allocated▲ up 61.7%up 22.2% after inflation2015 → 2024redrawnearliest
- GDP per person$86,087 allocated▲ up 50.5%up 13.7% after inflation2015 → 2024redrawnearliest
- Covered jobs287.7k allocatedno earlier figure2024
- Weekly wage$991 allocatedno earlier figure2024
- Income per person$66,402 allocated▲ up 40.4%up 6.1% after inflation2015 → 2024redrawnearliest
- Businesses24.0k allocatedno earlier figure2024
Each arrow is the latest published figure against the newest one published before Adrian Smith took this seat, with the two periods named beside it. A rate moves in percentage points; every other indicator is shown as a share of where it started, and a dollar figure also by how much it moved after inflation, with both figures restated in the same year’s dollars. A row marked redrawn is one whose district lines moved between the two figures: they describe different ground, so that change belongs to the seat number rather than to a fixed piece of land. A row marked earliest had nothing published before they took the seat, so it is measured from the first figure there is — a window that starts inside their tenure rather than at the beginning of it. These are conditions in the district, not a record of the member. Nothing here is evidence that they caused any of it, or that a different representative would have produced different numbers.
Average weekly wage, 2024
Average weekly pay across all covered jobs.
| Period | Weekly wage | In 2025 dollars | Margin of error | Coverage | Congress |
|---|---|---|---|---|---|
| 2024 | $991 allocated | $1,017 | — | 100.0% | 118th |
The "in 2025 dollars" figures are the published ones restated for inflation with the BLS Consumer Price Index for All Urban Consumers (CPI-U), U.S. city average, all items, annual average. A five-year estimate is published in the dollars of its final year, so 2016-2020 is adjusted from 2020 dollars. The adjustment is the same for every place in a period, so it changes no ranking; it says what a figure from an earlier period would be in today's money. It is not a local cost of living, and the margin of error is still the published one.
Total annual wages over average employment over 52 weeks, both counts stored so the division can be checked -- which is also how it is moved onto a district, the pair allocated separately and divided at the end. An AVERAGE, not a median: a handful of very large pay packets pull it well above what a typical worker earns, and median household income elsewhere on this site is the better measure of that. Counts jobs covered by unemployment insurance, which is about 95% of civilian wage and salary employment. It excludes most self-employment, most farm work on small farms, and some religious organisations, so it is a smaller number than the payroll survey's and is not a substitute for it. Published for counties, not for congressional districts. A district's figure is built by moving each overlapping county's counts across the county-to-district crosswalk and dividing at the end -- never by averaging county rates. The coverage column gives the share of the district's residents living in counties that reported.
Who represented this district
Every member who held NE-3, grouped by the stretches over which these lines stayed the same. The groups break where the chart above breaks, because the members either side of a redraw represented different ground.
| Member | Party | Years | Lines in force |
|---|---|---|---|
| Adrian Smith · 2 terms | Republican | 2009–2013 | 111th–112th Congresses |
| Lines redrawn for the 113th Congress — figures above and below describe different areas.Adrian Smith · 5 terms | Republican | 2013–2023 | 113th–116th Congresses |
| Lines redrawn for the 118th Congress — figures above and below describe different areas.Adrian Smith · 2 terms | Republican | 2023–present | 118th–119th Congresses |
Party is the party held during that term, not the member’s party today. A stretch ends where the district was redrawn: the members either side of a break represented different ground, so the seat number is the only thing they have in common. Nothing here says a member caused any figure on this page to move. Source: unitedstates/congress-legislators.